Translate this page into:
Gait analysis and clinical outcomes of anterior and lateral approach total hip arthroplasty: A prospective randomized study
 MD., Ahmed N. Mahmoud1MD., Amr Ibraheem1MD., Ahmed S. Eid1MD., Mai A. Ahmed2PhD., Amr K. Mahmoud1MD., Saleh Gameel1MD.
*Corresponding author: Karim Samir, Department of Orthopaedics, Ain Shams University, Cairo, Egypt. dr.karimsamir1@gmail.com
-
Received: ,
Accepted: ,
How to cite this article: Samir K, Mahmoud AN, Ibraheem A, Eid AS, Ahmed MA, Mahmoud AK, et al. Gait analysis and clinical outcomes of anterior and lateral approach total hip arthroplasty: A prospective randomized study. J Musculoskelet Surg Res. 2025;9:95-103. doi: 10.25259/JMSR_269_2024
Abstract
Objectives:
This study compared the lateral and direct anterior approaches (DAAs) for total hip arthroplasty (THA) regarding gait analysis and post-operative outcomes.
Methods:
Patients undergoing THA for osteonecrosis or primary osteoarthritis were randomized to either the lateral or DAA. Standardized surgical procedures and implants were used. Gait analysis, including temporal distance parameters, kinetics, and kinematics, was conducted at 6 weeks, 3 months, and 18 months.
Results:
Thirty-four patients (16 lateral, 18 anterior) participated, with comparable demographics. At 6 weeks, the anterior approach group had significantly higher Harris hip scores, improved gait speed, greater hip extension and external rotation moments, higher peak hip abduction angle, and reduced peak hip extension angle. The lateral approach (LA) group showed decreased hip abduction and internal rotation moments. By 3 and 18 months, outcomes were similar between groups.
Conclusion:
The anterior approach facilitates faster rehabilitation at 6 weeks, but outcomes converge with the LA by 3 and 18 months postoperatively.
Keywords
Direct anterior approach
Gait analysis
Lateral approach
Minimally invasive hip approach
Osteonecrosis
Total hip arthroplasty

INTRODUCTION
The lateral approach (LA) for total hip arthroplasty (THA) is widely used by orthopedic surgeons but involves releasing part of the gluteus medius, raising concerns about its impact on gait mechanics and delayed recovery postoperatively.[1-4] The direct anterior approach (DAA) is gaining popularity as an alternative, minimizing soft-tissue dissection using an internervous plane between the tensor fascia latae and sartorius muscle. The DAA is considered minimally invasive due to its shorter incision length and potential to preserve the hip musculature.[5]
However, the success of THA depends not only on the surgical approach but also on factors like bearing surface and implant placement.[6] Restoring normal gait is a critical outcome after THA, particularly in the 1st post-operative year. Gait analysis is a valuable tool for evaluating hip joint function postoperatively.[7-9]
Our institution has predominantly used the LA for THA for nearly five decades but has recently adopted the DAA, observing differences in early outcomes. The previous studies compared gait mechanics between DAA and LA postoperatively at 3 and 18 months. This prospective randomized trial aims to compare gait mechanics between these approaches using gait analysis starting from 6 weeks postoperatively.
MATERIALS AND METHODS
Forty patients were enrolled in this randomized prospective comparative cohort study between January 2021 and June 2023.
The inclusion criteria comprised skeletally mature adults aged 20–60 with unilateral primary hip osteoarthritis (OA) or osteonecrosis. Participants had to be independent and physically active, defined by their ability to perform daily tasks, climb two flights of stairs, and walk for 15 min.
Exclusion criteria included individuals with bilateral hip involvement, hip conditions other than primary OA or osteonecrosis, prior hip or spine surgery, body mass index (BMI) over 40, chronic uncontrolled comorbidities, psychological disorders, an American Society of Anesthesiologists (ASA) score above 2, chronic neurological deficits affecting gait, limb length discrepancy >1 cm, or post-operative complications that delayed weight bearing.
Sample size
To achieve 80% power with a significance level of 0.05, we conducted a single-tailed, a priori test using G*Power software (version 3.1.9.6; Heinrich-Heine-Universität, Düsseldorf). The calculation was based on gait analysis measurements and a clinically significant change of 10 points in the Harris-Hip Score (HHS). We determined that 14 patients per group were necessary, aiming to include 20 subjects to account for potential data loss during follow-up.
Randomization and confounders
Patients were randomly assigned to the DAA group (DAAG) or the LA group (LAG) using an online randomizer (www.randomizer.org). Randomization was employed to control for confounders at the study design level, ensuring an equal distribution of potential confounders, such as age, sex, weight, height, BMI, and ASA class, between the two groups.
Blinding
At recruitment, each subject was assigned a unique code, recorded by a non-clinical clerk (codekeeper). The codekeeper also managed the HHS, ASA, and gait analysis results and scheduled follow-up appointments. Before clinical assessments and gait analysis, the codekeeper ensured consistent wound/scar coverage across groups. The physical medicine specialist, two radiographers, and clinical examiner were blinded to group allocation. Although aware of group assignments, the surgical team did not participate in clinical evaluations or gait analysis.
Clinical assessment
A single clinical examiner, an experienced orthopedic surgeon with 10 years in the field, conducted all clinical examinations. The examiner assessed patients for surgical fitness, performed post-operative gait analysis, and measured limb length discrepancy. The HHS was measured and documented preoperatively, as well as at 6 weeks, 3 months, 6 months, 12 months, and 18 months postoperatively. Patients also completed the visual analog scale (VAS) pain questionnaire at 2 weeks, 6 weeks, 3 months, 6 months, 12 months, and 18 months postoperatively.
Radiographic assessment
Two independent radiologists assessed the pre-operative radiographs to confirm the diagnosis. They assessed the post-operative radiographs at 1 month, 3 months, 6 months, 12 months, and 18 months for implant malposition and signs of loosening.
Operative details
Four surgeons experienced in hip surgery and arthroplasty made up the same surgical team that operated on each patient. The classic LA[10] and DAA[11] were utilized.
Gait analysis
A single experienced physical medicine specialist conducted the gait analysis in a laboratory at 6 weeks, 3 months, and 18 months postoperatively. Three-dimensional kinematic and kinetic data were collected using eight high-speed infrared cameras (Qualisys motion analysis system, Oqus 1) at 240 frames per second, two force plates (AMTI), and 26 ten-millimeter passive retroreflective markers. The markers were positioned on specific landmarks of both lower limbs according to the modified Istituto Ortopedico Rizzoli model[12] [Figure 1].
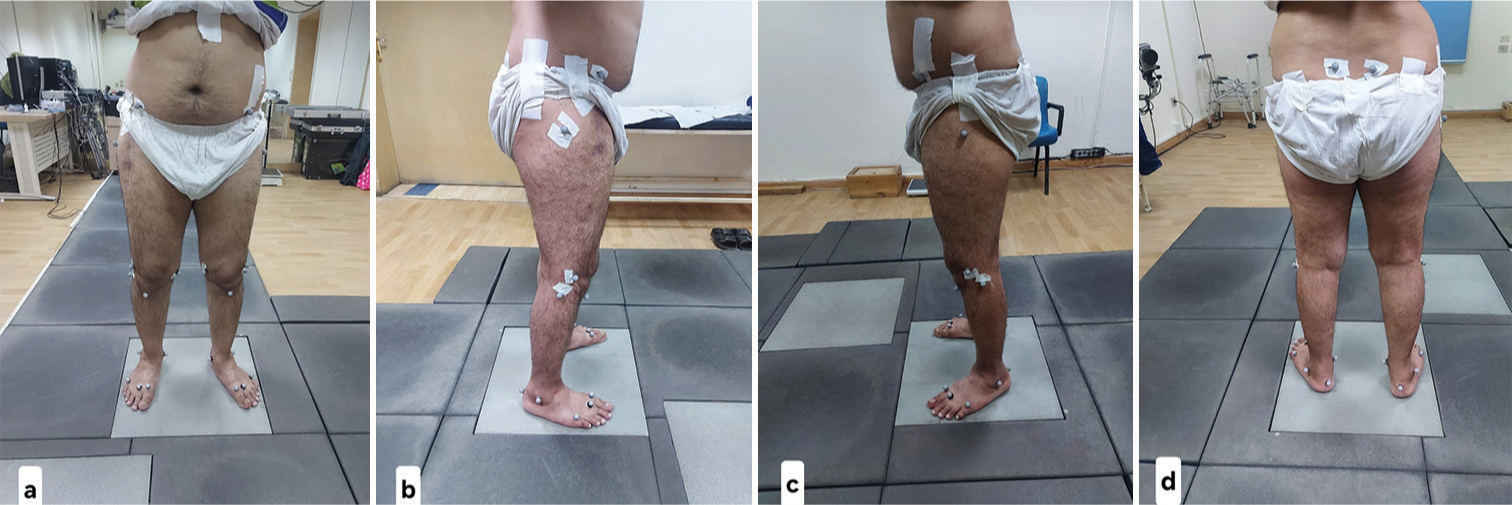
- (a-d) Markers placement on the subject.
During the static trial, six additional calibration markers were placed on each side’s 2nd metatarsal, medial malleolus, and medial femoral condyle. A static trial was recorded while the subject stood on the first force plate with arms abducted at 90° for 10 s. Body mass, marker orientation, and joint center positions for the knee and ankle were determined, after which the calibration markers were removed. Subjects then walked barefoot over the walkway at their self-selected speed, with at least six clean force plate strikes per lower limb. Three trials per limb were analyzed for consistency.
The static and dynamic trials were processed using the Qualisys Track Manager tool, and data were then extracted with the Visual 3D application. The kinematic and kinetic data were normalized to 51 points through a specialized pipeline.
Data and statistical analysis
Data were analyzed using the Statistical Package for the Social Sciences software version 23.0 (IBM, Armonk, NY). Quantitative data were summarized with range, mean, and standard deviation, while qualitative data were expressed as percentages and frequencies. The Chi-square test was used to compare the two groups’ nominal (qualitative) variables. Given that age, sex, weight, height, BMI, and ASA class were potential confounders, multivariate analysis of covariance was conducted to assess the impact of group allocation on dependent variables. For variables measured at multiple time points, a two-way repeated measures analysis of variance was applied. The margin of error was set at 5%, with a 95% confidence interval, so a p-value of less than or equal to 0.05 was considered significant. A minimal clinically important difference of 10 points was used for the HHS to determine clinical significance.[9]
RESULTS
The study aimed to include 40 patients who had THA, with 20 subjects assigned to each group. However, six patients were excluded due to noncompliance and insufficient follow-up data, resulting in 34 cases being analyzed (16 in the LAG and 18 in the DAAG).
The statistical analysis indicated that age, sex, weight, height, BMI, and ASA class did not significantly influence the VAS and HHS scores [Tables 1-3].
| Variable | Lateral approach number (%) | Anterior approach number (%) | Mean difference | P-value |
|---|---|---|---|---|
| Sex | ||||
| Male | 9 (56.2) | 10 (55.5) | 0.002 (χ2*) | 0.964** |
| Female | 7 (43.8) | 8 (44.5) | ||
| ASA class | ||||
| 1.00 | 12 (75) | 15 (83.4) | 0.36 (χ2*) | 0.549** |
| 2.00 | 4 (25) | 3 (16.6) | ||
| Age (years) mean (range) SD | 41.7 (23–58) ±11.1 | 44 (20–58) ±10.8 | −2.2 (t***) | 0.55** |
| Variable | Lateral approach mean±SD (Range) | Anterior approach mean±SD (Range) | t* mean difference | P-value | 95% confidence interval lower limit | 95% confidence interval upper limit |
|---|---|---|---|---|---|---|
| Weight (Kg) | 78.9±16.3 (52–111) | 80.8±11.4 (54–102) | −1.9 | 0.68** | −11.7 | 7.8 |
| Height (Meter) | 1.67±0.08 (1.47–1.82) | 1.68±0.08 (1.57–1.89) | −0.004 | 0.88** | −0.06 | 0.05 |
| BMI (Kg/m2) | 27.9±4.4 (20.5–38.2) | 28.7±4.3 (19.3–37.4) | −0.81 | 0.59** | −3.9 | 2.2 |
| Variable | Lateral approach mean±SD | Anterior approach mean±SD | t* mean difference | P-value | 95% confidence interval lower limit | 95% confidence interval upper limit |
|---|---|---|---|---|---|---|
| VAS | ||||||
| 2W | 5.3±1.3 | 4.8±0.9 | 0.47 | 0.24 NS | −0.34 | 1.2 |
| 1 M | 3.7±0.85 | 4.2±0.6 | −0.47 | 0.07 NS | −0.99 | 0.05 |
| 3 M | 2.4±0.96 | 2.8±0.8 | −0.39 | 0.21 NS | −1.03 | 0.24 |
| 6 M | 1.7±1 | 2.3±0.8 | −0.58 | 0.08 NS | −1.24 | 0.08 |
| 12 M | 1.6±1.1 | 2±0.9 | −0.36 | 0.32 NS | −1.11 | 0.37 |
| 18 M | 1.4±1 | 2±1 | −0.56 | 0.12 NS | −1.28 | 0.15 |
| P-value of difference over time** | 0.068 | 0.113 | ||||
| HHS | ||||||
| Pre-operative | 34.1±9.2 | 33.7±8.5 | 0.46 | 0.88 NS | −5.75 | 6.68 |
| 6 W | 73.0±1.4 | 79.9±1.3 | −6.9 | 0.00 S | −7.91 | −5.97 |
| 3 M | 83.7±1.5 | 84.1±1.4 | −0.36 | 0.49 NS | −1.41 | 0.69 |
| 6 M | 89.6±1.1 | 89.6±1.1 | −0.04 | 0.91 NS | −0.84 | 0.75 |
| 12 M | 92.6±2.2 | 92.5±2.1 | −0.18 | 0.8 NS | −1.34 | 1.72 |
| 18 m | 92.4±1.9 | 92.5±2.1 | −0.06 | 0.93 NS | −1.49 | 1.37 |
| P-value of difference over time** | 0.008 | 0.013 | ||||
The DAAG had significantly longer surgery times and greater intraoperative blood loss than the LAG. However, the length of hospital stay was similar between the groups [Table 4].
| Variable | Lateral approach mean±SD (Range) | Anterior approach mean±SD (Range) | t* mean difference | P-value | 95% confidence interval lower limit | 95% confidence interval upper limit |
|---|---|---|---|---|---|---|
| Surgery time (minutes) | 91.5±5.9 (80–100) | 108±7.8 (100–120) | −17 | 0.00** | −21.9 | −12.1 |
| Hemoglobin drop (mg/dL) | 2.2±0.3 (1.9–2.7) | 2.8±0.1 (2.7–3) | −0.59 | 0.000** | −0.75 | −0.43 |
| Hospital stays (days) | 3.8±0.7 (3–5) | 3.4±0.6 (3–5) | 0.43 | 0.069*** | −0.03 | 0.89 |
Gait analysis revealed a significant increase in gait speed for DAAG compared to LAG at 6 weeks (Student’s t-test). However, no significant differences were observed between the groups at 3 or 18 months, nor in stride length, step length, stance time, or swing time across all follow-up periods [Table 5].
| Variable | Lateral approach mean±SD (Range) | Anterior approach mean±SD (Range) | t* mean difference | P-value | 95% confidence interval lower limit | 95% confidence interval upper limit |
|---|---|---|---|---|---|---|
| Gait speed (meter/second) | ||||||
| 6W | 0.6±0.09 (0.5–0.8) | 0.8±0.04 (0.7–0.9) | −0.25 | 0.00 S | −0.30 | −0.20 |
| 3M | 0.9±0.03 (0.9–1) | 0.9±0.03 (0.9–1) | −0.00 | 0.99 NS | −0.02 | 0.02 |
| 18M | 1±0.09 (0.9–1.2) | 1±0.12 (0.9–1.3) | −0.02 | 0.45 NS | −0.10 | 0.05 |
| P-value of difference over time** | 0.057 | 0.217 | ||||
| Stride length (Meter) | ||||||
| 6W | 0.7±0.08 (0.5–0.8) | 0.7±0.1 (0.5–0.9) | 0.011 | 0.75 NS | –0.06 | 0.08 |
| 3M | 0.9±0.1 (0.8–1.1) | 0.9±0.1 (0.8–1.1) | −0.04 | 0.25 NS | −0.12 | 0.03 |
| 18M | 1±0.1 (0.8–1.2) | 1±0.1 (0.8–1.3) | −0.004 | 0.92 NS | −0.10 | 0.09 |
| P-value of difference over time** | 0.316 | 0.27 | ||||
| Step length (Meter) | ||||||
| 6W | 0.4±0.06 (0.3–0.5) | 0.4±0.07 (0.3–0.5) | −0.03 | 0.16 NS | −0.08 | 0.01 |
| 3M | 0.52±0.03 (0.4–0.5) | 0.5±0.03 (0.4–0.59) | 0.005 | 0.68 NS | −0.02 | 0.03 |
| 18M | 0.56±0.02 (0.51–0.59) | 0.57±0.02 (0.52–0.59) | −0.003 | 0.64 NS | −0.01 | 0.01 |
| P-value of difference over time** | 0.129 | 0.235 | ||||
| Stance time (Second) | ||||||
| 6W | 0.6±0.03 (0.57–0.67) | 0.6±0.03 (0.57–0.67) | −0.001 | 0.89 NS | −0.02 | 0.02 |
| 3M | 0.6±0.03 (0.57–0.67) | 0.6±0.03 (0.58–0.67) | −0.01 | 0.14 NS | −0.03 | 0.006 |
| 18M | 0.6±0.03 (0.57–0.67) | 0.6±0.03 (0.57–0.67) | −0.00 | 0.97 NS | −0.02 | 0.02 |
| P-value of difference over time ** | 0.931 | 0.968 | ||||
| Swing time (Second) | ||||||
| 6W | 0.3±0.03 (0.33–0.43) | 0.3±0.028 (0.33–0.43) | 0.00 | 0.86 NS | −0.01 | 0.02 |
| 3M | 0.3±0.029 (0.33–0.43) | 0.3±0.026 (0.33–0.42) | 0.01 | 0.13 NS | −0.00 | 0.03 |
| 18M | 0.3±0.03 (0.33–0.43) | 0.3±0.028 (0.33–0.43) | −0.00 | 0.99 NS | −0.02 | 0.02 |
| P-value of difference over time** | 0.92 | 0.986 | ||||
In gait kinetics, DAAG showed significantly higher peak hip extension and external rotation moments at 6 weeks compared to LAG, but these differences were not significant at 18 months. Conversely, LAG had a significant decrease in peak hip abduction and internal rotation moments at 6 weeks, which became non-significant at 3 and 18 months [Tables 6 and 7].
| Variable | Lateral approach mean±SD (Range) | Anterior approach mean±SD (Range) | t* mean difference | P-value | 95% confidence interval lower limit | 95% confidence interval upper limit |
|---|---|---|---|---|---|---|
| Peak vertical GRF (Newton) | ||||||
| 6 W | 1.03±0.06 (0.9–1.13) | 1.03±0.16 (0.8–1.3) | −0.00 | 0.99 NS | −0.08 | 0.08 |
| 3 M | 1.03±0.06 (0.9–1.13) | 1±0.1 (0.89–1.2) | 0.03 | 0.33 NS | −0.03 | 0.09 |
| 18 M | 1.01±0.07 (0.9–1.1) | 1±0.13 (0.89–1.3) | −0.00 | 0.81 NS | −0.08 | 0.06 |
| P-value of difference over time** | 0.925 | 0.826 | ||||
| Peak hip flexion moment (Newton. Meter) | ||||||
| 6 W | 0.56±0.23 (0.2–0.9) | 0.67±0.2 (0.3–1) | −0.108 | 0.15 NS | −0.26 | 0.04 |
| 3 M | 0.87±0.09 (0.57–1) | 0.86±0.1 (0.75–1) | 0.012 | 0.71 NS | −0.05 | 0.08 |
| 18 M | 0.88±0.1 (0.75–1) | 0.89±0.1 (0.75–1) | −0.00 | 0.82 NS | −0.08 | 0.06 |
| P-value of difference over time** | 0.223 | 0.495 | ||||
| Peak hip extension moment (Newton. Meter) | ||||||
| 6 W | −0.67±0.1 (−0.8–−0.49) | −1.28±0.13 (−1.4–−1) | 0.607 | 0.00 S | 0.51 | 0.69 |
| 3 M | −0.67±0.1 (−0.8–−0.49) | −0.5±0.2 (−0.89–−0.17) | −0.14 | 0.01 S | −0.26 | −0.02 |
| 18 M | −0.35±0.08 (−0.48–−0.23) | −0.37±0.07 (−0.49–−0.25) | 0.016 | 0.55 NS | −0.03 | 0.07 |
| P-value of difference over time** | 0.137 | 0.024 | ||||
| Peak hip Abd. Moment (Newton. Meter) | ||||||
| 6 W | 2±0.22 (1.8–2.6) | 2.7±0.47 (1.8–3.2) | −0.71 | 0.00 S | −0.98 | −0.45 |
| 3 M | 2.9±0.24 (2.6–3.2) | 3±0.25 (2.6–3.4) | −0.05 | 0.55 NS | −0.22 | 0.12 |
| 18 M | 3±0.23 (2.6–3.2) | 3±0.22 (2.6–3.2) | 0.00 | 0.94 NS | −0.15 | 0.16 |
| P-value of difference over time** | 0.069 | 0.813 | ||||
| Peak hip int. rotation moment (Newton. Meter) | ||||||
| 6 W | −0.56±0.26 (−0.8–−0.28) | −1.1±0.22 (−1.49–−0.89) | 0.56 | 0.00 S | 0.39 | 0.73 |
| 3 M | −1.3±0.12 (−1.49–−1.1) | −1.32±0.12 (−1.49–−1.13) | −0.02 | 0.54 NS | −0.11 | 0.05 |
| 18 M | −1.3±0.13 (−1.49–−1.1) | −1.34±0.13 (−1.49–−1.1) | 0.00 | 0.97 NS | −0.09 | 0.09 |
| P-value of difference over time** | 0.098 | 0.425 | ||||
| Peak hip ext. rotation moment (Newton. Meter) | ||||||
| 6 W | −0.5±0.26 (−0.8–−0.28) | −1.12±0.22 (−1.4–−0.89) | 0.56 | 0.00 S | 0.39 | 0.73 |
| 3 M | −1.35±0.12 (−1.4–−1.1) | −1.3±0.1 (−1.49–−1.1) | −0.025 | 0.54 NS | −0.11 | 0.05 |
| 18 M | −1.34±0.13(−1.4–−1.1) | −1.34±0.13 (−1.4–−1.13) | 0.00 | 0.97 NS | −0.09 | 0.09 |
| P-value of difference over time** | 0.098 | 0.425 | ||||
In gait kinematics, there were no significant differences in maximal hip flexion or external rotation angles between the two groups throughout the study. At 6 weeks, DAAG had a significantly larger peak hip abduction angle, and a significantly lower peak extension angle compared to LAG, but these differences were not significant at the 3- and 18-month follow-ups [Table 7].
| Variable | Lateral approach mean±SD (Range) | Anterior approach mean±SD (Range) | t* mean difference | P-value | 95% confidence interval lower limit | 95% confidence interval upper limit |
|---|---|---|---|---|---|---|
| Peak hip flexion (degree) | ||||||
| 6W | 21.65±6.1 (12.35–29) | 21.6±5.8 (12.3–29.6) | −0.01 | 0.99 NS | −4.19 | 4.15 |
| 3M | 24.4±3.6 (19–29.6) | 25.3±3.5 (19.1–29.6) | −0.92 | 0.46 NS | −3.46 | 1.60 |
| 18M | 25.6±2.8 (21–29) | 25.6±2.8 (21.3–29.65) | −0.07 | 0.94 NS | −2.07 | 1.92 |
| P-value of difference over time** | 0.699 | 0.684 | ||||
| Peak hip extension (Degree) | ||||||
| 6W | 7.2±3.6 (1.7–12) | 1±3.2 (−4.3–6.2) | 6.21 | 0.00 S | 3.80 | 8.62 |
| 3 M | 9.4±2 (4.7–12) | 9.7±1.3 (7.7–12) | −0.26 | 0.65 NS | −1.46 | 0.93 |
| 18 M | 10.2±1.2 (8.2–12) | 10.5±1.2 (8.2–12) | −0.21 | 0.62 NS | −1.09 | 0.66 |
| P-value of difference over time** | 0.501 | 0.138 | ||||
| Peak hip abduction (Degree) | ||||||
| 6W | 4.9±1.4 (2.1–6.9) | 10.4±1.7 (7.8–13) | −5.53 | 0.00 S | −6.66 | −4.41 |
| 3M | 10.2±1.8 (7.8–13) | 10.7±1.79 (7.8–13) | −0.46 | 0.46 NS | −1.73 | 0.80 |
| 18M | 10.3±1.84 (7.8–13) | 10.8±1.89 (7.8–13) | −0.48 | 0.45 NS | −1.79 | 0.82 |
| P-value of difference over time** | 0.074 | 0.971 | ||||
| Peak ext. rotation (Degree) | ||||||
| 6W | 14.7±4.9 (5.7–22.8) | 13.8±5.3 (5.7–22) | 0.91 | 0.6 NS | −2.69 | 4.53 |
| 3M | 16.7±4.5 (6.8–22) | 17±3.5 (12.2–22.8) | −0.33 | 0.81 NS | −3.17 | 2.50 |
| 18M | 16.4±3.5 (12–22) | 16.3±3.8 (12.2–22) | −0.1 | 0.93 NS | −2.49 | 2.69 |
| P-value of difference over time ** | 0.908 | 0.777 | ||||
DISCUSSION
The study supports that the DAA leads to less muscle injury and faster post-operative recovery than the LA. HHS, kinematic, and kinetic gait analysis parameters were significantly better in DAAG than LAG in the first 6 weeks but were similar at 3 and 18 months. There was no significant difference in hospital stay length between the groups, but DAAG had longer operation times and greater hemoglobin drops.
At the 6-week follow-up, gait speed was higher in the DAAG compared to the LAG, but other spatiotemporal parameters were similar between the groups in later follow-ups. Similar results were reported by Queen et al.,[13] Müller et al.,[7] Pospischill et al.,[14] and Varin et al.,[15] who found no significant differences in time-distance parameters at various post-operative points. However, Mayr et al.[16] and Klausmeier et al.[17] observed improved time-distance metrics favoring DAAG at 6 weeks, but not at later follow-ups. Varin et al.[15] noted that spatiotemporal parameters do not directly reflect joint force distribution, moment production, or joint function, urging caution in interpreting these findings.
In our study, the DAAG showed significant improvements in peak hip abduction and internal rotation moments at the 6-week gait analysis compared to LAG. The DAAG also had increased external rotation and extension moments, likely due to compensatory actions of the gluteus medius and maximus after releasing short external rotators in the anterior approach. In contrast, LAG had a smaller internal rotation moment at 6 weeks, possibly due to the surgical technique detaching the anterior third of the gluteus medius and minimus. By 3 and 18 months, no significant differences in hip kinetics were found between the groups.
In hip kinematics, the DAAG exhibited a significant increase in peak hip abduction angle and a lower extension angle at the 6-week follow-up compared to LAG, possibly due to a painful anterior incision. However, these differences were not significant at 3 and 18 months. Studies by Queen et al.,[13] Müller et al.,[7] Pospischill et al.,[14] and Klausmeier et al.[17] reported no notable changes between groups over time. Varin et al.[15] found that the DAA had sagittal plane kinematics closer to normal than LA, while Kiss and Illyés[18] observed reduced hip motion and increased pelvic tilt in LA patients early post-surgery, normalizing within a year. DAA showed quicker recovery and better functional results than LA, as supported by Mayr et al.[16] and Klausmeier et al.,[17] particularly at 6-week and 3-month follow-ups.
In the LA, partial detachment of the anterior third of the gluteus medius can weaken abductors, significantly impacting gait kinetics and kinematics early postoperatively.[19] Queen et al.[13] found that LAG had a larger adduction moment than the unoperated limb, likely due to pelvic drop during propulsion, indicating weak abductors. Mayr et al.[16] observed that patients with impaired abductor function compensated by internally rotating their hips, especially within the first 12 weeks post-surgery.
All the studies that compared the DAA and LA are shown in [Table 8].[13-18,20-24] From the results shown, our results align with all the published results.
| Study/year | Type | DAA | LA | Follow-up time | Variables | Results |
|---|---|---|---|---|---|---|
| Müller et al., 2012[7] | RCT | 15 | 15 | Preop, POD 12W | • Time-distance parameters, foot progression angle | • No effect of the surgical approach on the gait patterns or foot progression angle |
| Queen et al., 2014[13] | RCT | 11 | 12 | POD 1 year | • T ime-distance parameters | • No difference |
| • Hip kinetic and kinematic parameters | • No difference | |||||
| Pospischill et al., 2010[14] | RCT | 20 | 20 | POD 10 days, 12W | • Time-distance parameters, pelvic and hip kinetic and kinematics parameters, | • No significant difference |
| Varin et al., 2013[15] | CS | 20 | 20 | POD 10 days, 12W | • Time-distance parameters | • No difference |
| • Hip, knee, and ankle kinetic and kinematic parameters | • DAAG showed closer to normal sagittal plane kinematics | |||||
| Mayr et al., 2009[16] | RCT | 16 | 17 | Preop, POD 6W, 12W | • Time-distance parameters | • Improved DAAG over LAG at 6W but similar at 12 W |
| • Pelvic and hip kinetic and kinematic parameters | • DAAG faster recovery at 6W and 12 W | |||||
| Klausmeier et al., 2010[17] | CS | 12 | 11 | Preop, POD 6W, 16W | • Time-distance parameters | • Improved DAAG over LAG at 6W but similar at 16 W |
| • Hip kinetic and kinematic parameters, | • No significant difference between the two groups | |||||
| • Symmetry index of time-distance parameters | • DAAG recovered faster than LAG at 6W but both groups were symmetrical gait patterns at 16W | |||||
| Kiss and Illyés, 2012[18] | RCT | 40 | 40 | Preop, POD 12W, POD 6M, POD 1 year | • Time-distance parameters | • No difference |
| • Pelvis, hip, and knee kinetic and kinematic parameters | • DAAG yielded better functional outcomes than LAG | |||||
| Queen et al., 2011[21] | RCT | 15 | 8 | Preop, POD 6W | • Time-distance parameters | • No difference |
| • Hip kinetic and kinematic parameters | • No difference | |||||
| Wesseling et al., 2016[22] | CS | 23 | 8 | POD 1 year | • Time-distance parameters, hip kinetics & kinematic parameters | • No significant difference between the two groups |
| Palieri et al., 2011[23] | RCT | 15 | 15 | POD 4 W, 13 W | • Time-distance parameters | • No difference except swing phase is longer in DAAG than LAG |
| • Pelvic and hip kinetic and kinematic parameters | • Gait pattern after THA is strictly dependent on the surgical access and mainly on the extent and location of the surgical damage | |||||
| Martin et al., 2011[24] | CS | 42 | 41 | POD 1 year | • Time-distance parameters, hip kinetic and kinematic parameters | • No difference at 1 year post-operative |
| Our study | RCT | 18 | 16 | POD 6 W, 12 W, 18 M | • Time-distance parameters, hip kinetic and kinematic parameters, | • Improved in DAAG at 6 W but equal at 3 and 18 M |
RCT: Randomized controlled trial, POD: Post-operative day, CS: Comparative study, Preop: Pre-operative, DAAG: Direct anterior approach group, LAG: Lateral approach group, DAA: Direct anterior approach, LA: Lateral approach, THA: Total hip arthroplasty.
Limitations
Our study has some limitations. First, we focused only on the DAA and LA approaches for assessing THA outcomes, without including comparisons to the posterior approach. Second, a more robust method would have been to compare kinetic and kinematic outcomes by calculating the percentage difference between the affected and unaffected sides. This approach would allow for more accurate comparisons across individuals in the sample, reducing the impact of potential confounding factors.
CONCLUSION
Compared to the direct LA, the DAA for THA has a faster rehabilitation course, better functional outcomes, and significantly improved hip abductors’ kinetics and kinematics in the first 6 weeks postoperatively. However, both surgical approaches are comparable in the longer-term follow-up.
RECOMMENDATIONS
We recommend a systematic review to compare gait analysis outcomes for THA using the LA, DAA, and posterior approach.
AUTHORS’ CONTRIBUTIONS
KS conceived and designed the study, conducted research, provided research materials, and collected and organized data. ANM collected data, analyzed, and interpreted data. MAM wrote the initial gait analysis section and the article’s final draft. AI analyzed data and performed statistical analysis. AKM provided logistic support. SGR used the different THA approaches, lateral and anterior. All authors have critically reviewed and approved the final draft and are responsible for the manuscript’s content and similarity index.
ETHICAL APPROVAL
This study was authorized by our Institutional Ethics Board in January 2021 by the faculty of Medicine Ain Shams University research ethical committee (FMASU REC), approval number MD 03/2021. The FMASU REC operates under Federal Wide Assurance FWA No. 000017585. The study protocol is registered on ClinicalTrials.gov, number NCT06538519.
DECLARATION OF PATIENT CONSENT
The authors certify that they have obtained all appropriate patient consent forms. In the form, the patients have given their consent for their images and other clinical information to be reported in the journal. The patients understand that their names and initials will not be published, and due efforts will be made to conceal their identity, but anonymity cannot be guaranteed.
USE OF ARTIFICIAL INTELLIGENCE (AI)-ASSISTED TECHNOLOGY FOR MANUSCRIPT PREPARATION
The authors confirm that there was no use of artificial intelligence (AI)-assisted technology for assisting in the writing or editing of the manuscript and no images were manipulated using AI.
CONFLICTS OF INTEREST
There are no conflicting relationships or activities.
FINANCIAL SUPPORT AND SPONSORSHIP
This study did not receive any specific grant from funding agencies in the public, commercial, or not-for-profit sectors.
References
- Direct anterior versus lateral approaches for clinical outcomes after total hip arthroplasty: A meta-analysis. J Orthop Surg Res. 2019;14:63.
- [CrossRef] [Google Scholar]
- Comparing the anterior, posterior and lateral approach: Gait analysis in total hip arthroplasty. Can J Surg. 2018;61:50-7.
- [Google Scholar]
- Comparison of direct anterior and lateral approaches in total hip arthroplasty: A systematic review and meta-analysis (PRISMA) Medicine (Baltimore). 2015;94:e2126.
- [CrossRef] [Google Scholar]
- Surgical approach and prosthesis fixation in hip arthroplasty world wide. Arch Orthop Trauma Surg. 2013;133:1595-600.
- [CrossRef] [Google Scholar]
- A comparison of hospital length of stay and short-term morbidity between the anterior and the posterior approaches to total hip arthroplasty. J Arthroplasty. 2013;28:849-54.
- [CrossRef] [Google Scholar]
- Does surgical approach affect patient-reported function after primary THA? Clin Orthop Relat Res. 2016;474:971-81.
- [CrossRef] [Google Scholar]
- The direct lateral approach: Impact on gait patterns, foot progression angle and pain in comparison with a minimally invasive anterolateral approach. Arch Orthop Trauma Surg. 2012;132:725-31.
- [CrossRef] [Google Scholar]
- Preoperative factors associated with postoperative gait kinematics and kinetics after total hip arthroplasty. Osteoarthritis Cartilage. 2015;23:1685-94.
- [CrossRef] [Google Scholar]
- Patient-reported health outcomes after total hip and knee surgery in a Dutch University Hospital Setting: Results of twenty years clinical registry. BMC Musculoskelet Disord. 2017;18:97.
- [CrossRef] [Google Scholar]
- The direct lateral approach to the hip. J Bone Joint Surg Br. 1982;64:17-9.
- [CrossRef] [Google Scholar]
- Direct anterior approach for hip resurfacing: Surgical technique and complications. Clin Orthop Relat Res. 2011;469:1574-81.
- [CrossRef] [Google Scholar]
- Kinematic models of lower limb joints for musculo-skeletal modelling and optimization in gait analysis. J Biomech. 2017;62:77-86.
- [CrossRef] [Google Scholar]
- Total hip arthroplasty surgical approach does not alter postoperative gait mechanics one year after surgery. PM R. 2014;6:221-6.
- [CrossRef] [Google Scholar]
- Minimally invasive compared with traditional transgluteal approach for total hip arthroplasty: A comparative gait analysis. J Bone Joint Surg Am. 2010;92:328-37.
- [CrossRef] [Google Scholar]
- Does the anterior approach for THA provide closer-to-normal lower-limb motion? J Arthroplasty. 2013;28:1401-7.
- [CrossRef] [Google Scholar]
- A prospective randomized assessment of earlier functional recovery in THA patients treated by minimally invasive direct anterior approach: A gait analysis study. Clin Biomech (Bristol, Avon). 2009;24:812-8.
- [CrossRef] [Google Scholar]
- Is there faster recovery with an anterior or anterolateral THA? A pilot study. Clin Orthop Relat Res. 2010;468:533-41.
- [CrossRef] [Google Scholar]
- Comparison of gait parameters in patients following total hip arthroplasty with a direct-lateral or antero-lateral surgical approach. Hum Mov Sci. 2012;31:1302-16.
- [CrossRef] [Google Scholar]
- Muscle damage during MIS total hip arthroplasty: Smith-Petersen versus posterior approach. Clin Orthop Relat Res. 2006;453:293-8.
- [CrossRef] [Google Scholar]
- Variation of rotation moment arms with hip flexion. J Biomech. 1999;32:493-501.
- [CrossRef] [Google Scholar]
- The effect of total hip arthroplasty surgical approach on postoperative gait mechanics. J Arthroplasty. 2011;26:66-71.
- [CrossRef] [Google Scholar]
- Does surgical approach or prosthesis type affect hip joint loading one year after surgery? Gait Posture. 2016;44:74-82.
- [CrossRef] [Google Scholar]
- Surgical access and damage extent after total hip arthroplasty influence early gait pattern and guide rehabilitation treatment. Eur J Phys Rehabil Med. 2011;47:9-17.
- [Google Scholar]
- Anterolateral minimally invasive total hip arthroplasty: A prospective randomized controlled study with a follow-up of 1 year. J Arthroplasty. 2011;26:1362-72.
- [CrossRef] [Google Scholar]