Translate this page into:
Advancing joint disease diagnosis: Molecular profiling and biomarker identification in synovial fluid using Raman spectroscopy
*Corresponding author: Ahmed K. Al Ghaithi, Department of Surgery, Division of Orthopedic, Sultan Qaboos University, Muscat, Oman. a.alghaithi@squ.edu.om
-
Received: ,
Accepted: ,
How to cite this article: Al Ghaithi AK, Almaskari SM, Almutani MM, Al Bimani AM, Al-Jabri Z, Al Badi KS, et al. Advancing joint disease diagnosis: Molecular profiling and biomarker identification in synovial fluid using Raman spectroscopy. J Musculoskelet Surg Res. 2024;8:59-65. doi: 10.25259/JMSR_204_2023
Abstract
Objectives:
Synovial fluid (SF) analysis is crucial for diagnosing various joint diseases. This research delved into using Raman spectroscopy (RS) as a primary method for molecular profiling of SF and identifying significant biomarkers. The findings from this research have the potential to expand the utility of RS in diagnosing a diverse range of joint conditions.
Methods:
The SF samples were collected from patients undergoing knee joint surgeries and analyzed using RS coupled with a video microsampling system. Various strategies were implemented to minimize background fluorescence interference, a common challenge in biofluid RS analysis.
Results:
The spectral characteristics of fresh and overnight dry SF samples were compared revealing a reduction in background fluorescence in the dried samples. However, certain important signals were found to be absent due to overlap between Raman bands. The analysis showed distinct spectral features associated with hyaluronic acid, glycosaminoglycans, collagen, and proteins, highlighting their potential as biomarkers for joint diseases.
Conclusion:
Our study highlights the effectiveness of RS as a promising non-invasive method for analyzing SF. We have pinpointed specific biomarkers critical for joint health and disease paving the way for RS to potentially revolutionize the diagnosis and monitoring of joint pathologies. Despite the focus on osteoarthritis, the implications of this research extend to other complex joint diseases necessitating further investigation to enhance diagnostic precision and patient care.
Keywords
Arthritis
Biomarker
Joint
Raman spectroscopy
Synovial fluid

INTRODUCTION
Synovial fluid (SF) is a viscous fluid found in joint cavities providing lubrication and nourishment to the joints. It is produced by the joint synovial membrane and acts as a lubricant for joints reducing surface friction and facilitating movement.[1] The SF is a product of ultra-filtration of blood plasma mainly consisting of water, hyaluronic acid, collagenase, lubricant, and proteinase.
During the joint pathological course, SF ultra-structure undergoes chemical and biochemical changes due to protein composition and proteomic profile alterations.[2,3] The SF’s cytological and biochemical analysis has demonstrated its diagnostic value for several decades, particularly in the early detection of joint diseases such as inflammatory and infectious conditions.[3] Therefore, researchers employed various diagnostic modalities to analyze SF, starting with gross visual inspection of aspirated fluid to comprehensive laboratory investigation. These diagnostic modalities encompassed immunoassay, chromatography, mass spectrometry, and the promising emerging Raman spectroscopy (RS) technology.[3-5]
The RS is a non-destructive analytical technique based on the principle of light scattering.[6,7] It has shown its potential in the field of biomedical sciences, particularly in the examination and analysis of biological fluids. The RS involves directing a laser beam onto a sample for examination purposes. Then, light scattered is gathered and analyzed. During this process, a phenomenon known as Raman scattering takes place wherein the photons interact with the molecules in the sample.[8] As a result, the molecules’ energy levels experience a change or shift. This energy shift generates a spectrum that resembles a unique fingerprint enabling the identification and analysis of the molecular components within the sample.
However, RS analysis of biofluids encounters a notable obstacle in the form of background fluorescence. Background fluorescence in biofluid RS pertains to undesired signals that arise from the fluorescence emitted by the sample or surrounding components during Raman measurements.[6,9] As a result, this phenomenon poses a substantial challenge when analyzing signals. Consequently, effective background fluorescence management and reduction play a pivotal role in biofluid Raman analysis. These measures are essential for enhancing the sensitivity and specificity of Raman measurements ultimately enabling precise analysis of the desired target analytes of interest.[6]
This research delved into using RS as a primary method for molecular profiling of SF and identifying significant biomarkers. The study targets individuals with osteoarthritis due to its commonality and detailed characterization serving as an ideal model for testing RS diagnostic capabilities. Establishing RS benchmarks with this uniform patient group facilitates later application to more complex conditions. Human SF samples collected from knee joints during joint surgeries were employed for this purpose. The samples were subjected to systematic scanning using a Raman spectroscope coupled with a video micro-sampling system. Various measurement strategies were implemented to minimize background fluorescence interference.
MATERIALS AND METHODS
Samples preparations
Before commencing the study, all participants involved in the study provided written informed consent. All participants had the diagnosis of knee osteoarthritis primarily based on clinical presentation characterized by pain in the knee along with restrictions in the range of motion. In addition, knee radiographs were performed revealing joint degenerative arthritis changes with the presence of a definite osteophyte. The knee joints included in the study had radiographic severity of osteoarthritis ranging from 2 to 4 as assessed using the Kellgren/Lawrence grading criteria of osteoarthritis.[10]
The SF samples of 1–2 cc were obtained from 40 participants before undergoing total knee replacement or knee ligament reconstruction. Aseptic precautions were followed to ensure sterility, and fluid aspirations were performed using 18- or 20-gauge needles attached to a 20–60-mL syringe. The collected fluids were stored in sterile containers at a temperature of –20°C until the day of inoculation.
During the experimental day, the sample preparation involved using a pipette to carefully place 2 drops of SF (2–10 mL) onto various substrates such as a microscope slide with a cover slip, well slides microscope, fused silver mirror or microcuvette. The drops were then analyzed while they were still wet using a Raman spectroscope coupled with a video micro-sampling system. Subsequently, the drops were left to dry overnight at room temperature and re-examined afterward.
RS setup
The experimental setup consisted of an I-Raman Ex spectrometer® (BWTek, Newark, USA) equipped with a spectroscope and a 1064 nm excitation laser. The spectrometer was connected to a TE-cooled CCD camera operating at –200°C to capture Raman spectra. Each acquisition required a sample collection time (integration time) of 6 s/scan, and 20 scans were averaged to obtain a single spectrum.
For safety reasons and to avoid any damage to the samples, the laser powers were limited to 40% or lower. The spectroscopic wavelength range was set between 200 cm−1 and 2500 cm−1. The spectral data obtained from the spectrometer were processed using BWSpec® software (BWTek, Newark, USA), which facilitated the rendering and analysis of the spectra. The software also included baseline correction techniques to minimize background noise [Figure 1].
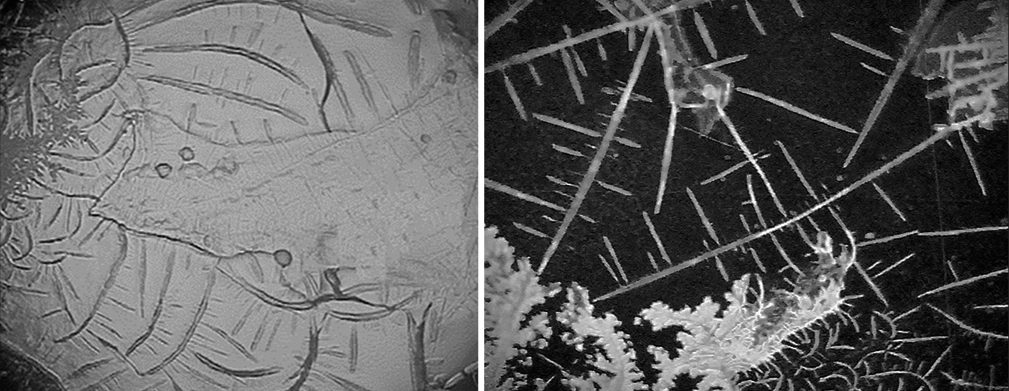
- Showcases two images captured using the video micro-sampling system. The first image presents an overnight dry sample on an AG mirror slide, while the second image portrays a fresh synovial sample on an AG mirror slide.
Background fluorescence management
We implemented several key strategies to manage background fluorescence effectively in our RS analysis. Our primary approach involved selecting a 1064 nm excitation laser. This wavelength is known for its ability to reduce fluorescence interference compared to shorter wavelengths, which was crucial for our study. However, using this laser also meant accepting some trade-offs such as a decrease in overall Raman signal strength and a limited maximum Raman shift detection capability of up to 2500 cm−1. We carefully balanced these factors to optimize our setup for accurate and reliable spectral data collection. We encountered significant background fluorescence during the spectral analysis, particularly when using the standard microscope and well slides. This interference negatively impacted the accuracy and integrity of our data. To overcome this challenge, we experimented with alternative sample holders, namely, a fused silver mirror and a microcuvette. Both options showed a marked reduction in background fluorescence compared to traditional slides leading to clearer and more precise spectral readings.
The microcuvette from Hellima® (Chadds Ford Township, PA, USA), specifically a 160-mL quartz cuvette, was effective in minimizing fluorescence and allowed for easy fluorescence subtraction through reference scans. However, it presented practical difficulties in handling the highly viscous SF, especially in transitioning between wet and dry sample states and in its maintenance. On the other hand, the fused silver mirror from ThorLabs® (Newton, NJ, USA) offered several advantages. It demonstrated significantly lower fluorescence than microscope slides and enhanced our spectral signal quality by reflecting more light back to the detector. Although this increased reflection presented a limitation in detecting Raman shifts below 500 cm−1, the mirror’s design facilitated easier sample distribution and effectively accommodated both wet and dry samples.
After evaluating both options, we concluded that the fused silver mirror’s benefits outweighed the operational challenges posed by the microcuvette. As a result, we adopted the fused silver mirror as our primary sample holder ensuring better control over background fluorescence and improving the overall quality of our Raman spectroscopic data.
RESULTS
Our analysis revealed distinct molecular signatures in SF samples from patients with severe osteoarthritis characterized by specific Raman peaks associated with biomarkers such as hyaluronic acid, glycosaminoglycans, collagen, and proteins. Notably, hyaluronic acid was identified at 1155 cm^−1 (which corresponds to C-O and C-C bonds), glycosaminoglycans like chondroitin sulfate around 1062 cm^−1 and 1126 cm^−1, collagen at 1541 and 1665 cm^−1 (amide I) and 1243 cm^−1 (amide III), and proteins at 895 cm−1. Phenylalanine, a marker of osteoarthritis progression, was consistently present across all samples, indicated by a peak at 1005 cm−1.[11]
A comparison of dry versus wet samples indicated that drying reduces background fluorescence but may also obscure critical signals due to overlapping Raman bands. These observations suggest that while dry samples offer some analytical benefits, they may not capture the complete molecular profile present in wet samples. Figures 1 and 2 provide visual representations of these findings displaying the differences in spectral characteristics between dry and wet samples and highlighting the impact of sample preparation on the quality of the Raman spectra obtained.
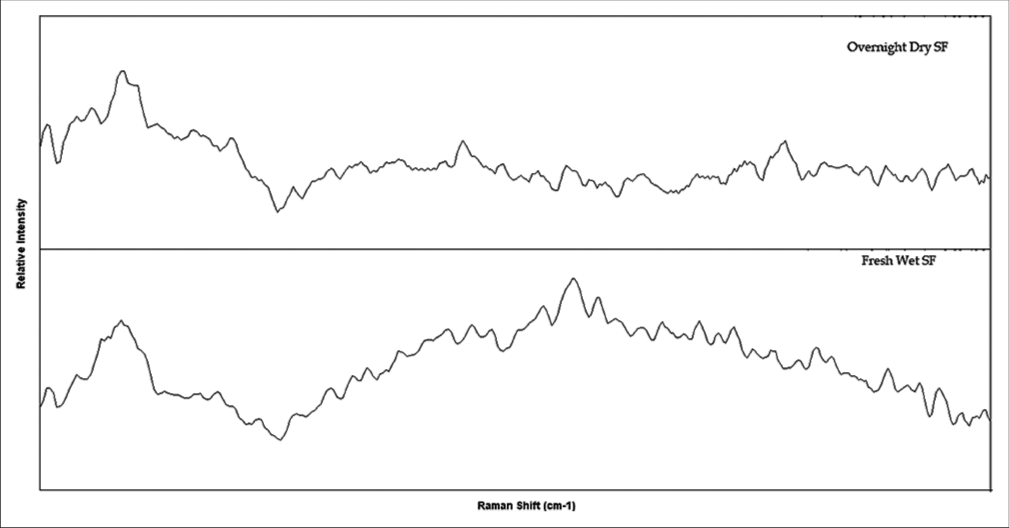
- Illustrates the captured Raman spectra from two samples on AG mirror slides before baseline correction. The first spectrum represents an overnight dry sample, while the second spectrum represents a fresh synovial sample. Notably, the dry sample exhibits considerably less background fluorescence in comparison to the fresh sample.
Table 1 presents the molecular profiling of SF and the identification of potential biomarkers that can be utilized for diagnosing joint pathologies. The table provides a comprehensive analysis of the molecular composition of SF and highlights specific biomarkers that hold promise for accurate diagnosis of various joint conditions.
| Wavenumber (cm−1) | Biological assignment | Vibrational assignment | References |
|---|---|---|---|
| 895 | Protein | C-C stretch | [12] |
| 937 | Sulfated glycosaminoglycans | [13] | |
| 1005 | Phenylalanine | [14,15] | |
| 1010 | Carotenoid | [16] | |
| 1062 | Sulfated glycosaminoglycans | [13] | |
| 1155 | Hyaluronic acid (Carotenoid) | C-O and C-C bonds | [14] |
| 1157 | Carotenoid | In-phase vibrations of the conjugated = C–C= | [14] |
| 1206 | Phenylalanine | [11] | |
| 1125 | Glycosidic linkage | C–C stretching | [17] |
| 1126 | Pyranose ring | C–C, C–O stretching | [14] |
| 1156 | Carotenoid | [16] | |
| 1235 | Amide III | In-phase combination of the NH bending and CN stretching | [18] |
| 1243 | Amide I | N-H bonds | [18] |
| 1313 | Lipids | CH3CH2twisting | [19,20] |
| 1318 | G ring breathing modes of the DNA/RNA | [21] | |
| 1346 | Lipids | CH3CH2wagging | [19,20] |
| 1375 | Proteoglycans (Amide III) | [22] | |
| 1440 | Lipids | CH2and CH3deformation | [4,19] |
| 1446 | Proteins and lipids | CH2bending | [4,19] |
| 1512 | Carotenoid | [14] | |
| 1541 | Amide III | N-H bonds | [23] |
| 1574 | Amide III | Out-of-phase combination of the NH bending and the CN stretching | [23] |
| 1660–1665 | Amide I | C=O stretching vibrations out-of-plane C–N stretching | [24] |
| 1745 | Lipids | C=O | [4,19] |
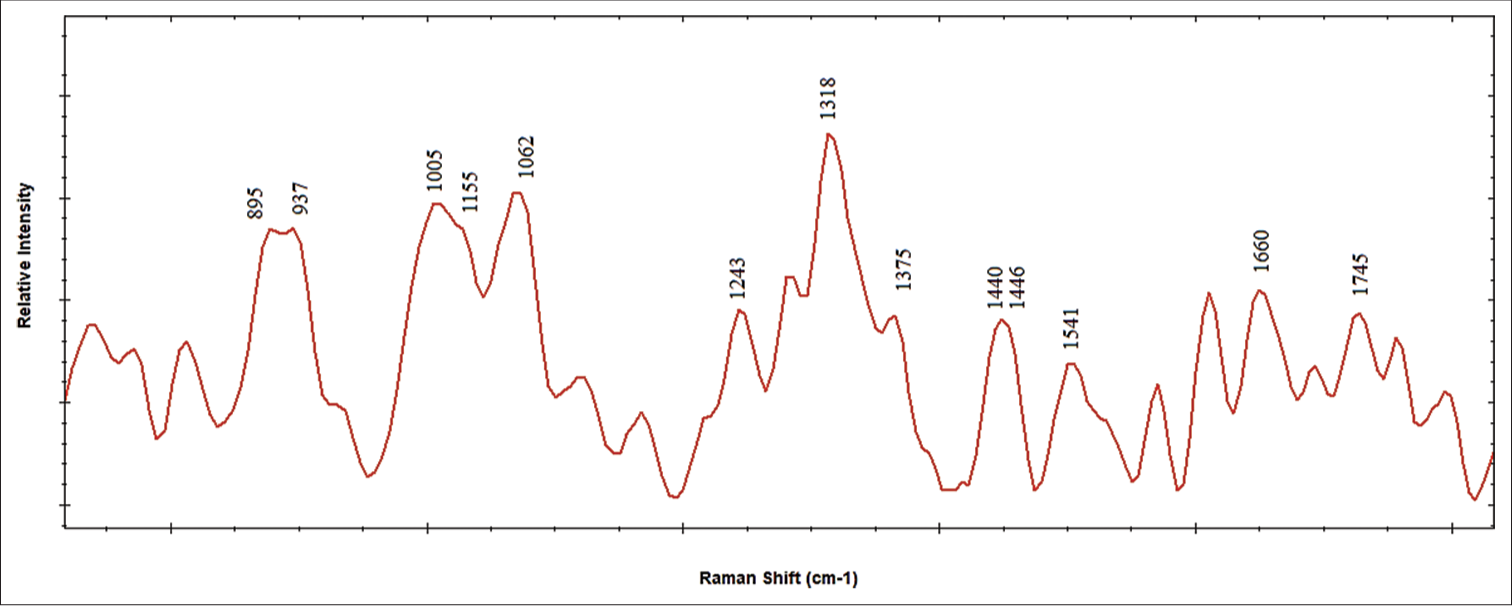
- Displays Raman spectra of synovial fluid with labeled molecular profiling for biomarker identification.
DISCUSSION
Our research revealed specific carotenoid Raman bands in SF at wave numbers 1010, 1155, 1157, and 1512 cm−1, aligning with Bocsa et al.’s initial findings on SF.[14,16] Our results also show strong peaks indicating collagen at 1541–1665 cm−1 (amide I) and 1243 cm−1 (amide III), echoing the diagnostic promise of RS for joint health assessment. The collagen-specific Raman band at 1665 cm−1 (amide I), as utilized by Prokopi et al. to distinguish between normal and deteriorating knee joint menisci, showed a notably higher intensity ratio in healthy tissue.[24] This underlines RS’s potential in evaluating meniscus degeneration through collagen-specific bands and their polarization. Gamsjaeger et al’s work on identifying Raman bands for proteoglycans in bone and cartilage suggested the band near 1375 cm−1 as a proteoglycan marker. Our findings also agree with those on detecting glycosaminoglycans, specifically chondroitin sulfate at 1062 cm−1 and a pyranose ring band at 1126 cm−1, reinforcing these bands’ reproducibility and diagnostic value.[22] The study by Elli et al. on structural glycosaminoglycan analysis provided parameters to quantify aggrecan in cartilage, which our findings support.[25] Our research expands on previous studies by quantitatively analyzing these bands in a larger osteoarthritis cohort suggesting a more direct correlation between band presence and disease severity. Furthermore, the detection of glycosaminoglycans, such as chondroitin sulfate, in our study lends additional support to their use as markers for cartilage health in OA patients.
Moreover, we found that SF contains a relatively constant component of (C = O) lipids at a wave number of 1440 and 1745 cm−1. The Raman spectra obtained in this study are consistent with Czamara et al.’s review on RS of lipids. In the review, 35 lipids were analyzed, and the selected compounds for examination encompassed saturated/unsaturated fatty acids, triacylglycerols, cholesterol, cholesteryl esters, and phospholipids.[19] Timchenko et al. also used this lipid component as a reference point in calculating optical coefficients. These coefficients were employed to monitor changes in the SF during the development of osteoarthritis. Using (C = O) lipids as a denominator, they could effectively analyze the alterations occurring in the SF associated with this condition.[4] D’Acunto et al. conducted a study on human lipids as tumor markers where they identified medium intensity bands at 1313 cm−1 and 1346 cm−1, which were associated with the CH3CH2 twisting mode and CH3CH2 wagging mode of lipids, respectively.[20] Our study extends this by confirming these lipid markers in a different patient population and underlines the utility of RS in tracking disease progression through lipid changes.
Furthermore, it is crucial to emphasize the importance of effectively managing and reducing background fluorescence in the context of RS for biofluid analysis. The presence of background fluorescence can significantly impact the accuracy and reliability of analytical results. Implementing measures to mitigate this issue is essential to enhance the sensitivity and specificity of Raman measurements ensuring precise analysis of the target analytes of interest.[6,9] Several strategies can be employed to address background fluorescence in RS of biofluids. One approach involves utilizing excitation lasers with reduced fluorescence-inducing properties.
In addition, appropriate sample preparation techniques can be employed. These techniques may involve filtering the biofluid samples to eliminate large particles or utilizing methods such as centrifugation or dialysis to remove interfering components that contribute to fluorescence.[26] The present study employed several measurement strategies to address background fluorescence. It was observed that significant background fluorescence occurred when using a microscope slide with a cover slip and well slides for microscopy. Conversely, using a fused silver mirror and microcuvette as sample holders demonstrated reduced background fluorescence making them more suitable options. Although the microcuvette reading process presented challenges, the decision was made to continue with the fused silver mirror as the preferred sample holder due to its favorable characteristics and lower background fluorescence.
In addition, using overnight drying of SF to reduce background fluorescence proves ineffective, as it leads to the absence of crucial signals. Our findings corroborate the study conducted by Esmonde et al. We observed that the spectra obtained from the edges of the droplets predominantly consisted of protein Raman bands, which offered ample data for assessing the physiochemical composition of human SF. Although there was an overlap between Raman bands from glycosaminoglycans and lipids with certain protein bands, these components exhibited relatively weak Raman scattering properties.[23]
This study is limited to all samples used from patients with established osteoarthritis with varying degrees of severity.
The complex nature of osteoarthritis may influence its manifestation and progression, which has the potential for significant differences in Raman spectral changes at different degrees of the disease. Our analysis of the acquired spectral Raman signals did not aim to establish a relationship with the osteoarthritis grade. However, while examining the acquired spectra, we note that the nature and extent of these spectral differences may vary between samples. In addition, the previous research has made some strides in exploring this topic.[27] Therefore, further work is needed to understand the relationship between Raman spectral signals and osteoarthritis classification grade comprehensively. This may improve our understanding of disease progression and contribute to the development of more accurate diagnostic tools as well as effective treatment strategies.
CONCLUSION
Our study highlights the effectiveness of RS as a promising non-invasive method for analyzing SF and detecting osteoarthritis. We have pinpointed specific biomarkers critical for joint health and disease paving the way for RS to potentially revolutionize diagnosing and monitoring joint pathologies. Despite the focus on osteoarthritis, the implications of this research extend to other complex joint diseases necessitating further investigation to enhance diagnostic precision and patient care.
AUTHORS’ CONTRIBUTIONS
AKA and JH contributed to developing the project idea, helped interpret the results, and prepared and revised the manuscript. ZAA, AMA, KSA, and MMA contributed to idea development, data collection, preparation, and manuscript revision. SMA contributed to developing the idea and critically revising the manuscript. All authors have critically reviewed and approved the final draft and are responsible for the content and similarity index of the manuscript.
ETHICAL APPROVAL
The research/study approved by the Institutional Review Board at Sultan Qaboos University, number 2624, dated 2/2020.
DECLARATION OF PATIENT CONSENT
The authors certify that they have obtained all appropriate patient consent forms. In the form, the patients have given their consent for their images and other clinical information to be reported in the journal. The patients understand that their names and initials will not be published and due efforts will be made to conceal their identity, but anonymity cannot be guaranteed.
USE OF ARTIFICIAL INTELLIGENCE (AI)-ASSISTED TECHNOLOGY FOR MANUSCRIPT PREPARATION
The authors confirm that there was no use of artificial intelligence (AI)-assisted technology for assisting in the writing or editing of the manuscript and no images were manipulated using AI.
CONFLICTS OF INTEREST
There are no conflicting relationships or activities.
FINANCIAL SUPPORT AND SPONSORSHIP
Dean of research and postgraduate education, Sultan Qaboos University Muscat Oman.
References
- Changes in synovial fluid biomarkers and clinical efficacy of intra-articular injections of hyaluronic acid for patients with knee osteoarthritis. J Exp Orthop. 2014;1:16.
- [CrossRef] [PubMed] [Google Scholar]
- Synovial fluid analysis In: StatPearls. Treasure Island, FL: StatPearls Publishing; 2023. Available from: http://www.ncbi.nlm.nih.gov/books/NBK537114 [Last accessed on 2023 Jul 08]
- [Google Scholar]
- Analysis of synovial fluid for study of diseases of joints using the method of Raman spectroscopy. KnE Energy. 2018;1:493-9.
- [CrossRef] [Google Scholar]
- Synovial fluid analysis. Best Pract Res Clin Rheumatol. 2005;19:371-86.
- [CrossRef] [PubMed] [Google Scholar]
- Investigating the growth of Pseudomonas aeruginosa and its influence on osteolysis in human bone: An in vitro study. Strategies Trauma Limb Reconstr. 2021;16:127-31.
- [CrossRef] [PubMed] [Google Scholar]
- Raman spectroscopy detects changes in bone mineral quality and collagen cross-linkage in Staphylococcus infected human bone. Sci Rep. 2018;8:9417.
- [CrossRef] [PubMed] [Google Scholar]
- Medical applications of Raman spectroscopy: From proof of principle to clinical implementation. Biopolymers. 2002;67:1-9.
- [CrossRef] [PubMed] [Google Scholar]
- Rejection of fluorescence background in resonance and spontaneous Raman microspectroscopy. J Vis Exp. 2011;51:2592.
- [CrossRef] [PubMed] [Google Scholar]
- Classifications in brief: Kellgren-Lawrence classification of osteoarthritis. Clin Orthop Relat Res. 2016;474:1886-93.
- [CrossRef] [PubMed] [Google Scholar]
- Phenylalanine is a novel marker for radiographic knee osteoarthritis progression: The MOST study. J Rheumatol. 2021;48:123-8.
- [CrossRef] [PubMed] [Google Scholar]
- Raman microspectroscopic analysis of the tissue-specific composition of the human osteochondral junction in osteoarthritis: A pilot study. Acta Biomater. 2020;106:145-55.
- [CrossRef] [PubMed] [Google Scholar]
- Label-free Raman monitoring of extracellular matrix formation in three-dimensional polymeric scaffolds. J R Soc Interface. 2013;10:20130464.
- [CrossRef] [PubMed] [Google Scholar]
- Knee osteoarthritis grading by resonant Raman and surface-enhanced Raman scattering (SERS) analysis of synovial fluid. Nanomedicine. 2019;20:102012.
- [CrossRef] [PubMed] [Google Scholar]
- Chemical imaging of articular cartilage sections with Raman mapping, employing uni-and multivariate methods for data analysis. Analyst. 2010;135:3193-204.
- [CrossRef] [PubMed] [Google Scholar]
- Potential and limits of Raman spectroscopy for carotenoid detection in microorganisms: Implications for astrobiology. Philos Trans A Math Phys Eng Sci. 2014;372:20140199.
- [CrossRef] [PubMed] [Google Scholar]
- Raman and infrared spectroscopy of carbohydrates: A review. Spectrochim Acta A Mol Biomol Spectrosc. 2017;185:317-35.
- [CrossRef] [PubMed] [Google Scholar]
- Raman spectroscopy of proteins: A review. J Raman Spectrosc. 2013;44:1061-76.
- [CrossRef] [Google Scholar]
- Raman spectroscopy of lipids: A review. J Raman Spectrosc. 2015;46:4-20.
- [CrossRef] [Google Scholar]
- Contribution of Raman spectroscopy to diagnosis and grading of chondrogenic tumors. Sci Rep. 2020;10:2155.
- [CrossRef] [PubMed] [Google Scholar]
- Label-free detection of human serum using surface-enhanced Raman spectroscopy based on highly branched gold nanoparticle substrates for discrimination of non-small cell lung cancer. J Chem. 2018;2018:e9012645.
- [CrossRef] [Google Scholar]
- Raman analysis of proteoglycans simultaneously in bone and cartilage. J Raman Spectrosc. 2014;45:794-800.
- [CrossRef] [Google Scholar]
- Raman spectroscopy of dried synovial fluid droplets as a rapid diagnostic for knee joint damage In: Biomedical optical spectroscopy. Bellingham: SPIE; 2008.
- [CrossRef] [Google Scholar]
- Collagen orientation probed by polarized Raman spectra can serve as differential diagnosis indicator between different grades of meniscus degeneration. Sci Rep. 2021;11:20299.
- [CrossRef] [PubMed] [Google Scholar]
- Structural analysis of glycosaminoglycans and proteoglycans by means of Raman microspectrometry. Connect Tissue Res. 2009;50:29-36.
- [CrossRef] [PubMed] [Google Scholar]
- The minimizing of fluorescence background in Raman optical activity and Raman spectra of human blood plasma. Anal Bioanal Chem. 2015;407:1335-42.
- [CrossRef] [PubMed] [Google Scholar]
- Raman spectroscopy of synovial fluid as a tool for diagnosing osteoarthritis. J Biomed Opt. 2009;14:34013.
- [CrossRef] [PubMed] [Google Scholar]