Translate this page into:
Bone tumors distribution in diagnostic and excisional biopsies
*Corresponding author: Ahmad Khaled Almigdad, Department of Orthopedic Surgery, Royal Medical Services, Amman, Jordan akmigdad_just@yahoo.com
-
Received: ,
Accepted: ,
How to cite this article: Almigdad AK, Dagher BZ, Alwaqfi OM, Ghabashneh MA, Alfqaha HA. Bone tumors distribution in diagnostic and excisional biopsies. J Musculoskelet Surg Res 2021;5(3):159-68.
Abstract
Objectives:
Bone tumors are uncommon. Nevertheless, bone is a common site for metastasis. Due to limited data regarding bone tumors in Jordan, this study aims to understand better bone tumor epidemiology and distribution in the Jordanian population.
Methods:
A part of a retrospective, single-center study, all biopsy reports confirming the diagnosis of a bone tumor between January 2017 and December 2019 were abstracted from Princess Iman Research Center records. The patients’ age, gender, anatomical location, and histopathological type of the tumors were obtained and analyzed.
Results:
Two hundred eighty-four diagnostic and excisional biopsies were reviewed. Most of the patients (60.2%) were males. The mean age for the patients was 26.74(±16.29) years. Malignant bone tumors were diagnosed in 15.5%. The femur was the most common site of biopsy diagnosed tumor followed by the tibia.
Osteochondroma was the most commonly diagnosed benign tumor and accounted for 39.4%, followed by aneurysmal bone cysts (14.8%), and enchondroma (10.2%). The metastatic bone tumors were the most frequent malignant bone pathology (6.7%), while osteosarcoma was the most common primary sarcoma, diagnosed in 5.6% of the sample. Increasing age, pelvic, and spine location of bone tumors were found to be significantly associated with malignancy.
Conclusion:
In our 284 samples, osteochondromas were the most commonly diagnosed tumors (39.4%), followed by aneurysmal bone cysts (14.8%), and enchondromas (10.2%). Metastatic tumors were the most common malignant bone pathologies, while osteosarcomas were the most common primary bone sarcomas. Femur and tibia were the most common tumor-located sites. Breast and lung deposition were the most common metastasis primaries. Additionally, increasing age, pelvic, and spine-located bone tumors were significantly associated with malignancy.
Keywords
Benign
Biopsy
Bone tumor
Jordan
Malignant

INTRODUCTION
Bone neoplasms are uncommon tumors; bone sarcomas account for less than 0.2% of overall tumors.[1] However, bone is considered the third most common metastasis site, just after lung and liver.[2] Common sources of metastasis to bone include breast, lung, thyroid, kidney and prostate. The spine is the most common target for metastasis.[3]
According to the World Health Organization (WHO) classification of soft tissue and bone tumors, bone tumors are classified according to the differentiation of neoplastic cells and their similarity to normal matches.[4] Accordingly, bone tumors are grouped into 15 categories. Cartilage producing, osteogenic producing, fibrogenic producing, giant cell, and notochordal origin are examples of this classification.[5,6] Currently, bone tumor classification is more complex and includes a combination of morphology, phenotype, and genotype parameters.[7,8]
Bone tumors may be detected incidentally or may be presented after a pathological fracture. Pain and palpable lump are common presenting features of bone tumors.[9] Bone pathology could be diagnosed based on clinical and radiological features. Nevertheless, a biopsy is a definitive test to confirm the diagnosis. However, not all bone-tumor cases required a biopsy for consecutive management.[10]
Estimating the annual incidence and prevalence of bone tumors is challenging since not all cases need investigation or treatment. Many tumors are diagnosed according to their radiological features and the fact that some of them are incidentally detected. Therefore, it is necessary to understand the distribution of bone tumors and their histopathological allocation. There are no sufficient resources about bone tumors in Jordan; most of them are hospital-based or concerning certain age groups or histopathological types. According to Jordan Cancer Registry, malignant bone tumor accounts for 0.9% of overall cancer in Jordan.[11] Regional resources are limited as well. Therefore, this study aimed to review the histopathological type of bone tumors and their distribution regarding age, gender, and anatomical locations to help in a better understanding of bone tumors and aid in diagnosis.
MATERIALS AND METHODS
This is a retrospective, single-center study conducted at Princess Iman Research Center (PIRC) at King Hussein Medical City (KHMC), one of the limited oncology-laboratory centers in Jordan. All biopsy reports confirming a bone tumor’s diagnosis between January 2017 and December 2019 were abstracted from PIRC’s records.
Princess Iman Research Center receives specimens from KHMC and all-district military hospitals in Jordan, which insures many Jordanian population sectors. All biopsies were evaluated at PIRC by two histopathologists, first by a specialist for the diagnosis, then confirmed by a consultant.
The patients’ age, gender, anatomical location, and histopathological types of the tumors were obtained and analyzed. Tumors are classified into benign and malignant tumors; metastatic tumors were assessed with malignant ones. Additionally, benign and malignant tumors were assessed according to anatomical location, tumor origin, gender, and age group.
A total of 284 confirmed bone tumor specimen were evaluated. The study included all diagnostic or excisional biopsies confirming bone tumors, limbs and trunk location of bone tumor, and a single diagnosis biopsy. Skull bone tumors and reports with more than one possible diagnosis were excluded.
Statistical data analysis
Descriptive analysis with the mean and standard deviation was applied to continuously measured variables and the frequency and percentages for categorical variables. In addition, the statistical normality assumption was tested with the histograms, and the statistical Kolmogrove– Smirnov test and the equal variance assumption was tested with Levene’s test.
The unpaired samples’ t-test was used to assess the statistical significance of mean difference on metric variables across patients’ binary dichotomous variables levels. The chi-squared test of independence (χ2-test) was used to evaluate the statistical value of associations between categorically measured variables. However, the residual analysis with the adjusted standardized residuals was used along with the chi-squared test of association to identify influential cells within the contingency tables for their clinical implications. Cells within the contingency (chi-squared) test tables with a standardized adjusted residual above or below (+1.96) were considered the influential cells with a more or less predicted likelihood for the analyzed outcomes like malignancy association with patients age and gender.
The chi-squared Goodness-Of-Fit test (χ2-G.O.F) was used to assess the statistical significance of the distribution of soft tissue tumors across the patients’ body locations and age groups.
The Statistical Package for the Social Sciences (SPSS) IBM Version 21 (Chicago) was used for the statistical data analysis, and the alpha significance level was considered at the 0.050 level.
RESULTS
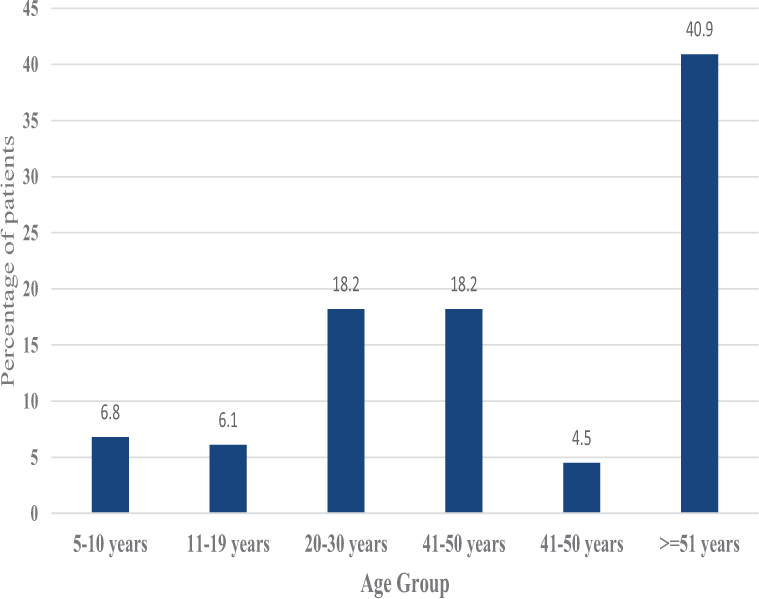
Two hundred eighty-four patients’ biopsy results were reviewed retrospectively. Table 1 summarizes findings for the patients’ sociodemographic, tumor body location, and histopathological characteristics. Males represented most of the study sample (60.2%). The majority of the patients were younger than 30 years. The mean age for the patients was 26.74(±16.29) years. Figure 1 demonstrates the distribution of biopsy-based tumor percentage across age groups.
| Frequency | Percentage | Frequency | Percentage | ||
|---|---|---|---|---|---|
| Gender | Frequency of bone tumors in the histopathological specimen | ||||
| Female | 113 | 39.8 | Benign tumors | ||
| Male | 171 | 60.2 | Osteochondroma | 112 | 39.4 |
| Age (years) mean (SD) | 26.74(±16.29) | Aneurysmal bone cyst | 42 | 14.8 | |
| Age groups | Enchondroma | 29 | 10.2 | ||
| 5–10 years | 26 | 9.2 | Giant cell tumor of bone | 19 | 6.7 |
| 11–20 years | 92 | 32.4 | Osteoid osteoma | 17 | 6 |
| 21–30 years | 84 | 29.6 | Chondroblastoma | 10 | 3.5 |
| 31–40 years | 34 | 12 | Fibrous dysplasia | 6 | 2.1 |
| 41–50 years | 18 | 6.3 | Non-ossifying fibroma | 3 | 1.1 |
| ≥ 51 years | 30 | 10.6 | Solitary bone cyst | 2 | 0.7 |
| Tumor location | Malignant tumors | ||||
| Femur | 76 | 26.8 | Metastasis | 19 | 6.7 |
| Tibia | 67 | 23.6 | Osteosarcoma | 16 | 5.6 |
| Humerus | 33 | 11.6 | Chordoma | 6 | 2.1 |
| Hand | 28 | 9.9 | Ewing’s sarcoma | 2 | 0.7 |
| Spine | 20 | 7 | Chondro sarcoma | 1 | 0.4 |
| Foot | 16 | 5.6 | Metastatic source | ||
| Fibula | 11 | 3.9 | Breast | 7 | 36.8 |
| Radius | 11 | 3.9 | Lung | 6 | 31.6 |
| Pelvis | 9 | 3.2 | Kidney | 2 | 10.5 |
| Scapula | 8 | 2.8 | Prostate | 2 | 10.5 |
| Chest wall | 5 | 1.8 | Lymphoma | 1 | 5.3 |
| Pancreaticobiliary | 1 | 5.3 | |||
| Tumor general classification | Age group collapsed based on 40 year | ||||
| Benign | 240 | 84.5 | ≤ 40 years | 236 | 83.1 |
| Malignant | 44 | 15.5 | > 41 years | 48 | 16.9 |

- The proportions of the biopsy-based tumor within different age groups.
Regarding the bone tumor distribution according to the body locations, the femur (26.8) was the most common site of the biopsy-diagnosed tumor, followed by the tibia. The majority of tumors were of a benign type found in 84.5% of the specimens. Considering the bone tumor ori gin, most of them (53.5%) had chondroid-producing tumors, followed by giant cell originated-tumors (21.5%). Osteoid-producing tumors accounted for 11.6% of the specimens, while metastatic deposition represented 6.7%.
Concerning the frequency of bone tumors according to biopsies’ findings, osteochondroma was the most commonly (39.4%) diagnosed tumor in histopathological specimens. The metastatic bone tumors were the most frequent malignant bone pathology (6.7%), and osteosarcoma was the most common primary sarcoma (5.6%) [Figure 2]. Breast and lung cancer deposition were the most common metastatic source to bone and accounted for 36.8% and 31.6%, respectively.
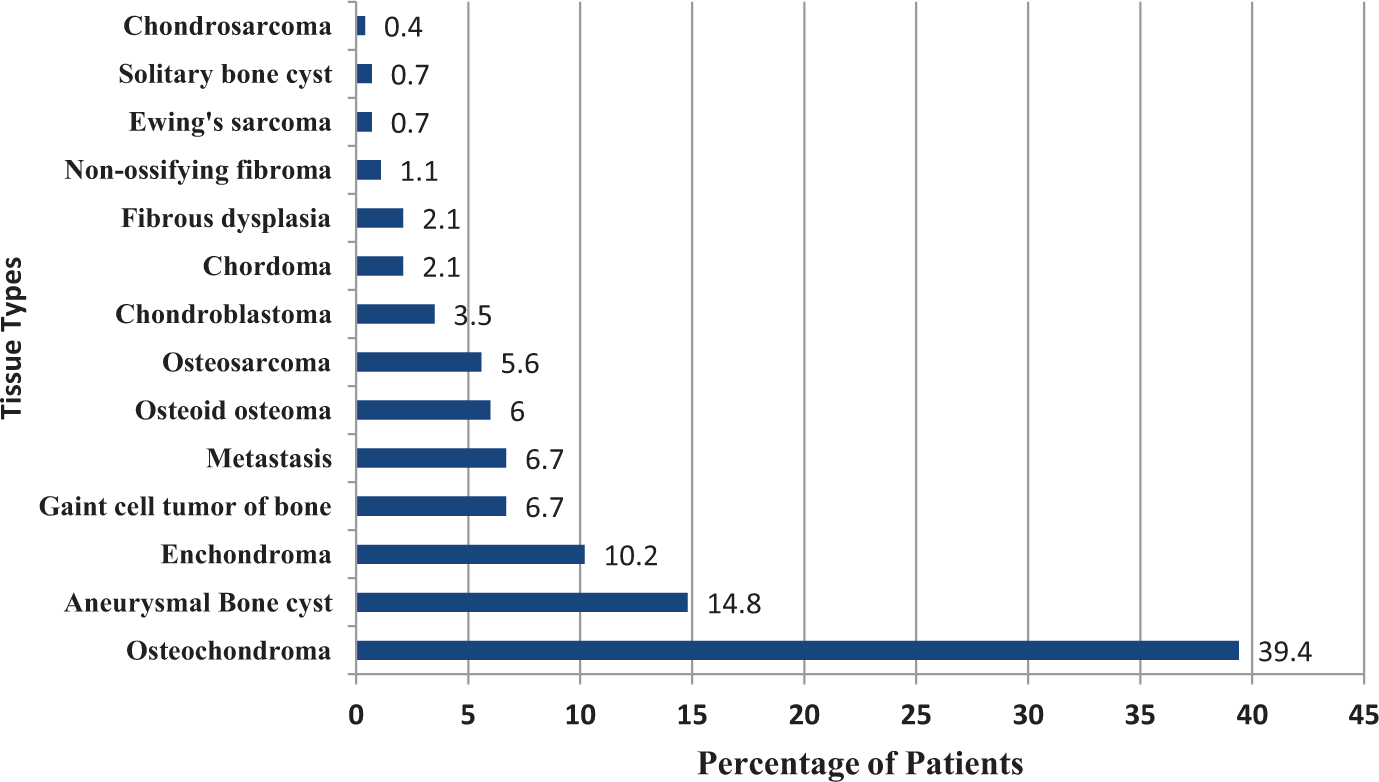
- The percentage of patients with various bone tumor types.
Table 2 gives a detailed distribution of specific tumors regarding their anatomical location. Most tumors occur in long bones. However, chest wall, scapula, and pelvis were uncommon sites for bone tumors.
| Femur | Tibia | Humerus | Hand | Spine | Foot | Fibula | Radius | pelvis | Scapula | Chest Wall | |
|---|---|---|---|---|---|---|---|---|---|---|---|
| Osteochondroma | 36(32.1) | 35(31.3) | 10(8.9) | 5(4.5 ) | 0 | 5(4.5) | 6(5.4) | 4(3.6) | 2(1.8) | 8(7.1) | 0 |
| Aneurysmal bone cyst | 13(31) | 8(19) | 8(19) | 2(4.8) | 1(2.4) | 3(7.1) | 4(9.5) | 2(4.8) | 1(2.4) | 0 | 0 |
| Enchondroma | 2(6.9) | 1(3.4) | 0 | 20(69) | 0 | 2(6.9) | 1(3.4) | 1(3.4) | 0 | 0 | 2(6.9) |
| Giant cell tumor of bone | 1(5.3) | 7(36.8) | 5(26.3) | 1(5.3) | 1(5.3) | 2(10.5) | 0 | 2(10.5) | 0 | 0 | 0 |
| Osteoid osteoma | 1(50) | 1(50) | 0 | 0 | 0 | 0 | 0 | 0 | 0 | 0 | 0 |
| Chondroblas- toma | 3(30) | 3(30) | 2(20) | 0 | 0 | 1(10) | 0 | 1(10) | 0 | 0 | 0 |
| Fibrous dysplasia | 1(16.7) | 1(16.7) | 0 | 0 | 0 | 0 | 0 | 0 | 1(16.7) | 0 | 3(50) |
| Non-ossifying fibroma | 0 | 2(66.7) | 0 | 0 | 0 | 0 | 0 | 1(33.3) | 0 | 0 | 0 |
| Solitary bone cyst | 6(35.3) | 4(23.5) | 2(11.8) | 0 | 2(11.8) | 2(11.8) | 0 | 0 | 1(5.9) | 0 | 0 |
| Metastasis | 3(15.8) | 0 | 5(26.3) | 0 | 10(52.6) | 0 | 0 | 0 | 1(5.3) | 0 | 0 |
| Osteosarcoma | 9(56.3) | 4(25) | 1(6.3) | 0 | 0 | 0 | 0 | 0 | 2(12.5) | 0 | 0 |
| Chordoma | 0 | 0 | 0 | 0 | 6(100) | 0 | 0 | 0 | 0 | 0 | 0 |
| Ewing’s sarcoma | 0 | 1(50) | 0 | 0 | 0 | 0 | 0 | 0 | 1(50) | 0 | 0 |
| Chondrosarcoma | 1(100) | 0 | 0 | 0 | 0 | 0 | 0 | 0 | 0 | 0 | 0 |
The numbers between brackets are the percentage of patients in relation to the tumor type.
By analyzing bone tumors’ correlation with sociodemographic characteristics [Table 3], biopsy-based bone tumors were most commonly diagnosed from femur, tibia, humerus, and hand. There was no statistical correlation between patients’ gender with the malignancy (p = 0.869). Nevertheless, patients with bone sarcomas were older than those with benign tumors; the mean age for bone sarcomas was 28.12 years compared to 23.78 years in the benign group.
| Tumor classification | ||||
|---|---|---|---|---|
| Benign | Malignant | Test statistic | p-value | |
| Gender | ||||
| Female | 95(39.2) | 18(40.9) | χ2(1)=0.03 | 0.869 |
| Male | 145(60.4) | 26(59.1) | ||
| Age (years) mean (SD) | 23.78(12.99) | 42.89(22.17) | t(48.56) = 5.55 | 0.009 |
| Age group | ||||
| 5–10 years | 23(9.6) | 3(6.8) | χ2(5) = 44.60 | < 0.001 |
| 11–19 years | 87(36.2) | 5(11.4) | ||
| 20–30 years | 76(31.7) | 8(18.2) | ||
| 41–50 years | 26(10.8) | 8(18.2) | ||
| 41–50 years | 16(6.7) | 2(4.5) | ||
| ≥ 51 years | 12(5) | 18(40.9) | ||
| Age group collapsed based on 40 year | ||||
| ≤ 40 years | 212(88.3) | 24(54.5) | χ2(1) = 30.22 | < 0.001 |
| ≥ 41 years | 28(11.7) | 20(45.5) | ||
| Tumor location | ||||
| Femur | 63(26.2) | 13(29.5) | χ2(10) = 76.11 | < 0.001 |
| Tibia | 62(25.8) | 5(11.4) | ||
| Humerus | 27(11.2) | 6(13.6) | ||
| Hand | 28(11.7) | 0 | ||
| Spine | 4(1.7) | 16(36.4) | ||
| Foot | 16(6.7) | 0 | ||
| Fibula | 11(4.6) | 0 | ||
| Radius | 11(4.6) | 0 | ||
| Pelvis | 5(2.1) | 4(9.1) | ||
| Scapula | 8(4.6) | 0 | ||
| Chest wall | 5(2.1) | 0 | ||
| Tumor origin general types | ||||
| Chondroid producing | 151(62.9) | 1(2.3) | χ2(7) = 187.14 | < 0.001 |
| Giant cell origin | 61(25.4) | 0 | ||
| Osteoid producing | 17(7.1) | 16(36.4) | ||
| Secondary tumor | 0 | 19(43.2) | ||
| Fibrous tissue producing | 9(3.8) | 0 | ||
| Giant cell | 61(25.4) | 0 | ||
| Notochord origin | 0 | 6(13.6) | ||
| Tumor-like lesion | 2(0.8) | 0 | ||
| Unknown origin | 0 | 2(4.5) | ||
The mean age for the metastatic tumors was 62.32, and the mean age for all malignant bone tumors was 42.89 years (p = 0.009). Figure 3 demonstrates the percentage of patients with definitive malignant tumors across patients’ age groups. Additionally, the tumor location had converged significantly on the malignancy potential. The patients with pelvic and spine located bone tumors were significantly more malignant than tumors of other body parts, p < 0.001.
- Percentage of patients with definitive malignant tumors across patient’s age groups.
Also, the patients’ gender was statistically significantly associated with the bone tumor type, location, origin, and malignancy [Tables 4 and 5]. The analysis showed that the male patients were significantly younger than females (p < 0.001). Moreover, the review revealed a statistically significant association between the tumor location and the patients’ gender, p = 0.001. Male patients were found to be significantly less related for pelvic and hand tumors compared to females. However, they were found significantly more related to femur tumors than females, p < 0.001. Secondary bone tumors were noticed more in female patients (p = 0.023), which can be explained by the frequency of breast cancer in Jordan. Similarly, the patients’ age groups were explored for a statistical association of bone tumors with anatomical locations, origins, types, and staging. Although the middle age period is somewhat arbitrary and varies from person to person, we used a 40-year cut point for analytical purposes. Table 6 showed that patients older than 41 years were significantly associated with spine tumors, secondary tumor depositions, notochord tumor origins, chondromas, fibrous dysplasias, giant tumors, and osteoid osteomas compared to younger age groups (p < 0.001). Moreover, patients older than 41 years had lower femoral and tibial tumor location frequency in addition to lower chondroid and osteoid producing tumor origins and aneurysmal bone cysts (p < 0.001).
| Patients gender | ||||
|---|---|---|---|---|
| Female | Male | Test statistic | p-value | |
| Age (years) mean (SD) | 31.03(18.20) | 23.90(14.30) | t(199.6) = 3.51 | < 0.001 |
| Age group collapsed based on 40 years | ||||
| ≤ 40 years | 81(71.7) | 155(90.6) | χ2(1) = 17.42 | < 0.001 |
| > 41 years | 32(28.3) | 16(9.4) | ||
| Tumor location | ||||
| Femur | 19(16.8) | 57(33.3) | χ2(10) = 30.96 | 0.001 |
| Tibia | 21(18.6) | 46(26.9) | ||
| Humerus | 18(15.9) | 15(8.8) | ||
| Hand | 16(14.2) | 12(7) | ||
| Spine | 11(9.7) | 9(5.3) | ||
| Foot | 9(8) | 7(4.1) | ||
| Fibula | 5(4.4) | 6(3.5) | ||
| Radius | 5(4.4) | 6(3.5) | ||
| Pelvis | 7(6.2) | 2(1.2) | ||
| Scapula | 2(1.8) | 6(3.5) | ||
| Chest wall | 0 | 5(2.9) | ||
| Tumor origins | ||||
| Chondroid producing | 54(47.8) | 98(57.3) | χ2(7) = 16.2 | 0.023 |
| Giant cell origin | 33(29.2) | 28(16.4) | ||
| Osteoid producing | 9(8) | 24(14) | ||
| Secondary tumor | 12(10.6) | 7(4.1) | ||
| Fibrous tissue producing | 2(1.8) | 7(4.1) | ||
| Notochord origin | 2(1.8) | 4(2.3) | ||
| Tumor-like lesion | 0 | 2(1.2) | ||
| Unknown origin | 1(0.9) | 1(0.6) | ||
| Patients gender | ||||
|---|---|---|---|---|
| Female | Male | Test statistic | p-value | |
| Histopathological returned tissue finding | ||||
| Benign tumors | ||||
| Osteochondroma | 33(29.2) | 79(46.2) | χ2(14) = 37.13 | 0.001 |
| Aneurysmal bone cyst | 19(16.8) | 23(13.5) | ||
| Enchondroma | 19(16.8) | 10(5.8) | ||
| Giant cell tumor of bone | 14(12.4) | 5(2.9) | ||
| Osteoid osteoma | 6(5.3) | 11(6.4) | ||
| Chondroblastoma | 2(1.8) | 8(4.7) | ||
| Fibrous dysplasia | 1(0.9) | 5(2.9) | ||
| Non-ossifying fibroma | 1(0.9) | 2(1.2) | ||
| Solitary bone cyst | 0 | 2(1.2) | ||
| Malignant tumors | ||||
| Metastasis | 12(10.6) | 7(4.1) | ||
| Osteosarcoma | 3(2.7) | 13(7.6) | ||
| Chordoma | 2(1.8) | 4(2.3) | ||
| Ewing’s sarcoma | 1(0.9) | 1(0.6) | ||
| Chondrosarcoma | 0 | 1(0.6) | ||
| Metastatic source | ||||
| Breast | 7(58.3) | 0 | χ2(5) = 14.60 | 0.012 |
| Kidney | 1(8.3) | 1(14.3) | ||
| Lung | 2(16.7) | 4(57.1) | ||
| Lymphoma | 1(8.3) | 0 | ||
| Pancreatic-biliary | 1(8.3) | 0 | ||
| Prostate | 0 | 2(28.6) | ||
| Patients age | ||||
|---|---|---|---|---|
| ≤ 40 years | > 41 years | Test statistic | p-value | |
| Tumor location | ||||
| Femur | 70(29.7) | 6(12.6) | χ2(10) = 46.15 | < 0.001 |
| Tibia | 61(25.8) | 6(12.5) | ||
| Humerus | 26(11) | 7(14.6) | ||
| Hand | 23(9.7) | 5(10.4) | ||
| Spine | 7(3) | 13(27.1) | ||
| Foot | 13(5.5) | 3(5.2) | ||
| Fibula | 11(4.7) | 0 | ||
| Radius | 9(3.8) | 2(4.2) | ||
| Pelvis | 4(1.7) | 5(10.4) | ||
| Scapula | 8(3.4) | 0 | ||
| Chest wall | 4(1.7) | 1(2.1) | ||
| Tumor origins | ||||
| Chondroid producing | 137(58.1) | 15(31.2) | χ2(7) = 67.54 | < 0.001 |
| Giant cell origin | 52(22) | 9(18.8) | ||
| Osteoid producing | 32(13.6) | 1(2.1) | ||
| Secondary tumor | 2(0.8) | 17(35.4) | ||
| Fibrous tissue producing | 6(2.5) | 3(6.2) | ||
| Notochord origin | 3(1.3) | 3(6.2) | ||
| Tumor-like lesion | 2(0.8) | 0 | ||
| Unknown origin | 2(0.8) | 0 | ||
|
Histopathological returned tissue finding Benign tumors |
||||
| Osteochondroma | 106(44.9) | 6(12.5) | χ2(13) = 87.94 | < 0.001 |
| Aneurysmal bone cyst | 40(16.9) | 2(4.2) | ||
| Enchondroma | 22(9.3) | 7(14.6) | ||
| Giant cell tumor of bone | 12 (5.1) | 7(14.6) | ||
| Osteoid osteoma | 16(6.8) | 1(2.1) | ||
| Chondroblastoma | 8(3.4) | 2(4.2) | ||
| Fibrous dysplasia | 4(1.7) | 2(4.2) | ||
| Non-ossifying fibroma | 2(0.8) | 1(2.1) | ||
| Solitary bone cyst | 2(0.8) | 0 | ||
| Malignant tumors | χ2(13) = 87.94 | < 0.001 | ||
| Metastasis | 2(0.8) | 17(35.4) | ||
| Osteosarcoma | 16(6.8) | 0 | ||
| Chordoma | 3(1.3) | 3(6.2) | ||
| Ewing sarcoma | 2(0.8) | 0 | ||
| Chondrosarcoma | 1(.4) | 0 | ||
DISCUSSION
In this study, we collected all bone tumor-biopsy results over three years; subsequently, just the tumors that were evaluated histopathologically were included. Secondary to this data collection design, the tumors not treated surgically nor investigated by diagnostic or excisional biopsies were not included. Therefore, this explains some findings in our study. For example, we found low numbers of non-ossifying fibroma in this study because this type of tumor is diagnosed incidentally and usually does not require treatment or biopsy evaluation. On the other hand, we found many osteochondromas in this study sample. Although their diagnosis can be made with accuracy by imaging only, but many surgeons prefer to confirm the pathology of the excised tumor, we found a high number of them. Similarly, although the hand is not usually a common location of bone tumors, the hand was the fourth common body tumor location in this study, secondary to many enchondroma diagnosed biopsies, which is a common benign hand tumor.
Comparative studies are limited in Jordan. Therefore, regional studies were utilized to match our findings. Sevimli in 2017, retrospectively evaluated 710 patients who were hospitalized at Inonu University Turgut Ozal Medical Center in Turkey, with pre-diagnosis of a tumor, over 7 years. Osteochondroma was the most common benign tumor, whereas the most commonly seen malignant bone tumor was chondrosarcoma followed by multiple myeloma and osteosarcoma.[12] Although the distribution of benign tumors in our study was similar, the distribution of bone sarcoma was different.
Öztürk et al. retrospectively evaluated 3133 patients with presumed musculoskeletal tumors in a tertiary clinic from different Turkey regions between January 2002 and July 2013. Osteochondromas, enchondroma, and simple bone cysts were the most common benign tumors, while osteosarcoma, Ewing’s sarcoma, and chondrosarcoma were the most commonmalignant tumors, according to Öztürk’s study.[13] In another study in a military hospital in Turkey, similar comparative findings were found by Neyisci et al. on 317 bone localized tumors.[14]
Another regional comparative study from Iran by Solooki et al., 426 pathologic reports from 1997 to 2008 were reviewed. The findings were as follows: the commonest malignant bone tumors were osteosarcoma, metastasis, Ewing’s sarcoma, and chondrosarcoma. The most frequent benign bone tumors were osteochondroma, enchondroma, giant cell tumor, and osteoid osteoma. The femur was the most commonly involved site in musculoskeletal tumors, followed by the tibia in benign tumors and the humerus in malignant ones.[15]
Despite similar results in our study compared to regional ones, it is still challenging to know the actual bone tumor prevalence secondary to many factors, including that many tumors are incidentally diagnosed, many others still in subclinical presentation. Furthermore, different design studies are required as well as radiological diagnosis-based studies. Nevertheless, having data based on local studies gives clues about the prevalence of bone tumors and aids in diagnosis. In addition, for the better outcome of tumor management, the diagnosis and management should be centralized. In Jordan, there are a few referral centers for cancer management. Although many tumor cases are treated outside these centers, mutual and collaborative studies between these centers would improve our understanding of tumor prevalence in Jordan.
CONCLUSION
In our 284-sample, osteochondroma was the most commonly diagnosed tumor (39.4%), followed by aneurysmal bone cysts (14.8%), and enchondromas (10.2%). Metastatic tumor was the most common malignant bone pathologies, while osteosarcoma was the most common primary bone sarcomas. Femur and tibia were the most common tumor-located sites. Breast and lung deposition were the most common metastasis primaries. Additionally, increasing age, pelvic, and spine-located bone tumors were significantly associated with malignancy.
RECOMMENDATIONS
Bone tumor data are limited in Jordan and require further studies. Therefore, collaborative studies between all tumor centers in Jordan and different design studies are recommended to understand bone tumor distribution better.
AUTHORS CONTRIBUTIONS
AKM, BZD, MAG conceived and designed the study. AKM, OMA, HAA conducted research, provided research material, and collected and organized data. AKM and OMA analyzed and interpreted data. AKM, BZD and MAG wrote the initial and final draft of the article. All authors have critically reviewed and approved the final draft and are responsible for the manuscript’s content and similarity index.
ETHICAL APPROVAL
This study has been approved by the local ethical committee of the Jordanian Royal Medical Services under study ID: RMS 1-2021:19 on January 19th 2021.
Declaration of patients consent
The authors certify that they have obtained all appropriate patients consent forms. In the form, the patients have given their consent for their images and other clinical information to be reported in the journal. The patients understands that their names and initials will not be published and due efforts will be made to conceal their identity, but anonymity cannot be guaranteed.
Financial support and sponsorship
This study did not receive any specific grant from funding agencies in the public, commercial, or not-for-profit sectors.
Conflicts of interest
There are no conflicts of interest.
References
- Bone sarcoma pathology: diagnostic approach for optimal therapy. Am Soc Clin Oncol Educ Book. 2017;37:794-8.
- [CrossRef] [PubMed] [Google Scholar]
- Hallmarks of Bone Metastasis. Calcif Tissue Int. 2018;102:141-51.
- [CrossRef] [PubMed] [Google Scholar]
- Understanding the bone in cancer metastasis. J Bone Miner Res. 2018;33:2099-113.
- [CrossRef] [PubMed] [Google Scholar]
- Sarcoma classification: an update based on the 2013 World Health Organization Classification of Tumors of Soft Tissue and Bone. Cancer. 2014;120:1763-74.
- [CrossRef] [PubMed] [Google Scholar]
- Refinements in sarcoma classification in the current 2013 World Health Organization Classification of Tumours of Soft Tissue and Bone. Surg Oncol Clin N Am. 2016;25:621-43.
- [CrossRef] [PubMed] [Google Scholar]
- World Health Organization Classification of Tumours In: Pathology and Genetics of Tumours of Soft Tissue and Bone. Lyon: IARC Press; 2002.
- [Google Scholar]
- New tumour entities in the 4th edition of the World Health Organization Classification of Head and Neck tumours: odontogenic and maxillofacial bone tumours In: Virchows Arch. Vol 472. 2018. p. :331-9.
- [CrossRef] [PubMed] [Google Scholar]
- Epidemiology and classification of bone tumors. Clin Cases Miner Bone Metab. 2012;9,2:92-5.
- [Google Scholar]
- Practical input on bone tumor imaging: pathological fracture, risk features, and when to contact orthopaedics. Semin Musculoskelet Radiol. 2019;23:19-25.
- [CrossRef] [PubMed] [Google Scholar]
- Ministry of Health. 2015. http://www.moh.gov.jo/Echobusv3.0/SystemAssets/3465ef25-4ef3-4d46-bd6e-c3fcbca5048f.pdf
- [Google Scholar]
- Distribution and evaluation of primary bone and soft tissue tumors admitted from Malatya province and surrounding provinces. Med Sci. 2017;6:546-50.
- [CrossRef] [Google Scholar]
- Distribution and evaluation of bone and soft tissue tumors operated in a tertiary care center. Acta Orthop Traumatol Turc. 2019;53:189-94.
- [CrossRef] [PubMed] [Google Scholar]
- Battle against musculoskeletal tumors: descriptive data of Military Hospital experience. Front Public Health. 2020;8:97.
- [CrossRef] [PubMed] [Google Scholar]
- Epidemiology of musculoskeletal tumors in Shiraz, south of Iran. Indian J Med Paediatr Oncol. 2011;32:187-91.
- [CrossRef] [PubMed] [Google Scholar]